Offer Ends In !!
Statistics With Minitab Course
Minitab is very powerful statistical software and has a long history of development since 1972, Minitab is geared towards data tables, visualization and graphics.
- Minitab provides a wide variety of statistical tools.
With interaction, one analysis leads to refinement and one discovery to another.
- The software...
READ MORE
READ MORE
This combination does not exist.
Introduction Video

Course Contents
Learners must have a basic knowledge of statistics.
| No. | Contents | Type |
|---|---|---|
| 1. | Worksheet, Data Management, and the Calculator |
|
| Introduction |
Online |
|
| Opening an Excel file in Minitab |
Online |
|
| Opening data from Access using ODBC |
Online |
|
| Stacking several columns together |
Online | |
| Stacking blocks of columns at the same time |
Online |
|
| Transposing the columns of a worksheet |
Online |
|
| Splitting a worksheet by categorical column |
Online |
|
| Creating a subset of data in a new worksheet |
Online | |
| Extracting values from a date/time column |
Online |
|
| Calculator – basic functions |
Online |
|
| Calculator – using an if statement |
Online |
|
| Coding a numeric column to text values |
Online | |
| Cleaning up a text column with the calculator |
Online | |
| 2. | Tables and Graphs |
|
| Finding the Tally of a categorical column |
Online | |
| Building a table of descriptive statistics |
Online | |
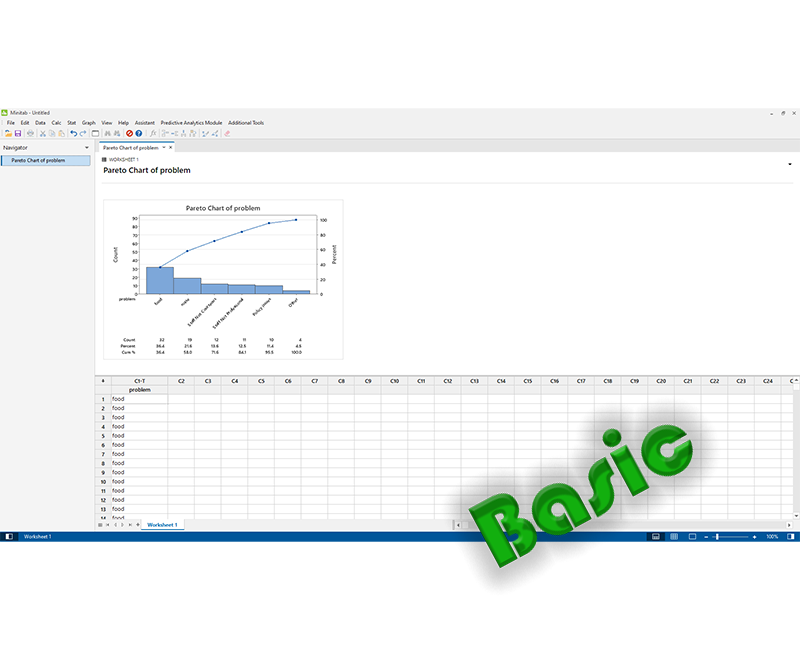
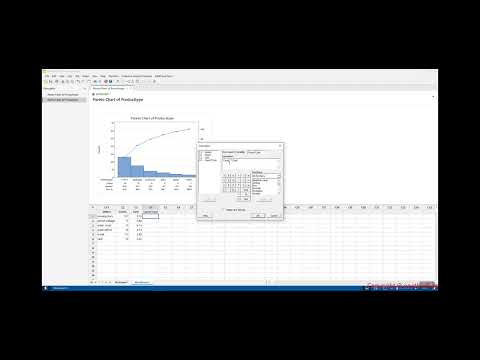
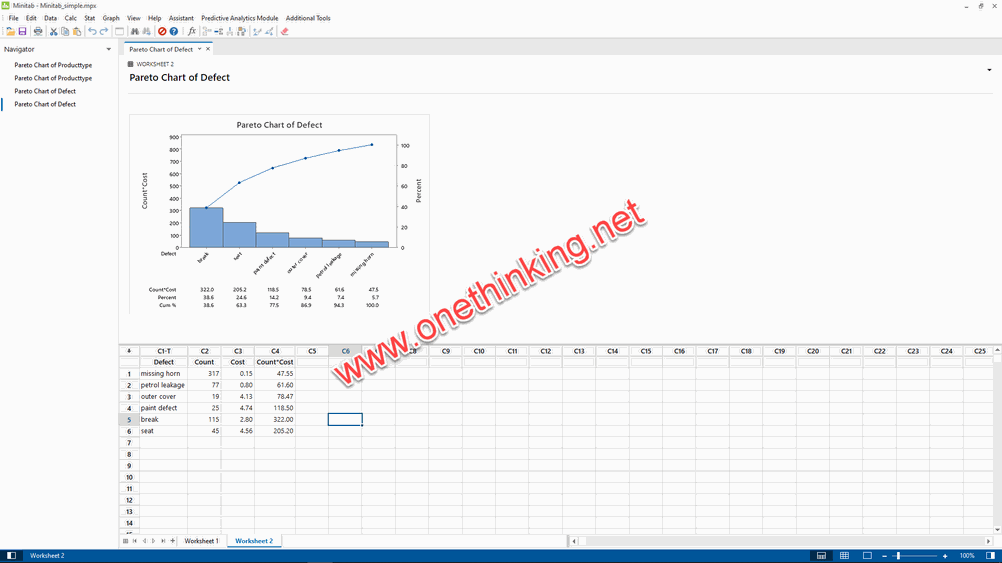
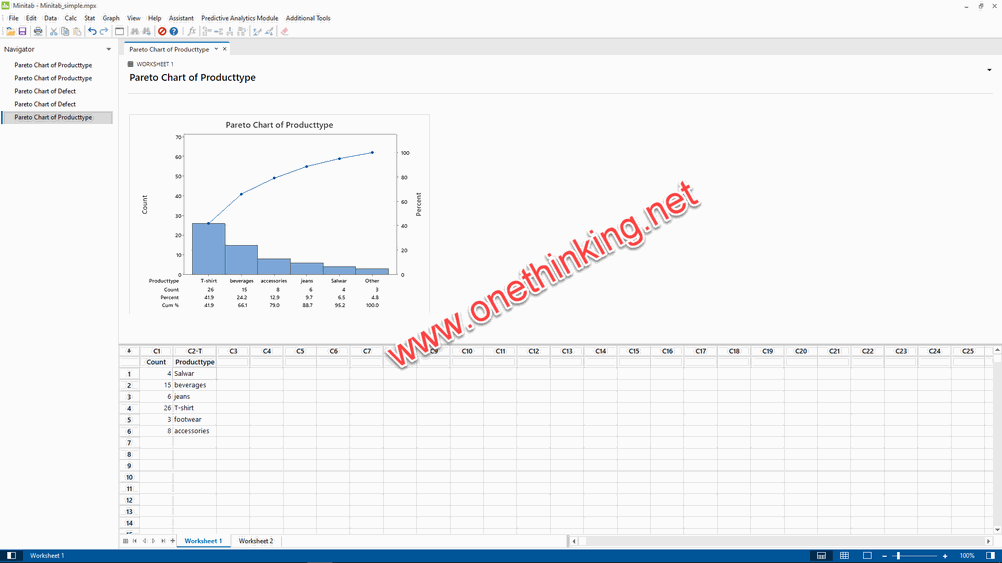
| Creating Pareto charts |
Online | |
| Creating bar charts of categorical data |
Online | |
| Creating a bar chart with a numeric response |
Online | |
| Creating a scatterplot of two variables |
Online | |
| Generating a paneled boxplot |
Online | |
| Finding the mean to a 95 percent confidence on interval plots |
Online | |
| Using probability plots to check the distribution of two sets of data |
Online | |
| Creating a layout of graphs |
Online | |
| Creating a time series plot |
Online | |
| Adding a secondary axis to a time series plot |
Online | |
| 3. | Basic Statistical Tools |
|
| Producing a graphical summary of data |
Online | |
| Checking if data follows a normal distribution |
Online |
|
| Comparing the population mean to a target with a 1-Sample t-test |
Online |
|
| Using the Power and Sample Size tool for a 1-Sample t-test |
Online |
|
| Using the Assistant menu for a 1-Sample t-test |
Online |
|
| Looking for differences in the population means between two samples with a 2-Sample t-test |
Online |
|
| Using the Power and Sample Size tool for a 2-Sample t-test |
Online |
|
| Using the Assistant menu to run the 2-Sample t-test |
Online |
|
| Finding critical t-statistics using the probability distribution plot |
Online |
|
| Finding correlation between multiple variables |
Online |
|
| Using the 1 Proportion test |
Online |
|
| Graphically presenting the 1 Proportion test |
Online |
|
| Using the Power and Sample Size tool for a 1 Proportion test |
Online |
|
| Testing two population proportions with the 2 Proportions test |
Online |
|
| Using the Power and Sample Size tool for a 2 Proportions test |
Online |
|
| Using the Assistant menu to run a 2 Proportions test |
Online |
|
| Finding the sample size to estimate a mean to a given margin of error |
Online |
|
| Using Cross tabulation and Chi-Square |
Online |
|
| Using equivalence tests to prove zero difference between the mean and a target |
Online |
|
| Calculating the sample size for a 1-Sample equivalence test |
Online |
|
| 4. | Using Analysis of Variance |
|
| Using a one-way ANOVA with unstacked columns |
Online |
|
| Calculating power for the one-way ANOVA |
Online |
|
| Using Assistant to run a one-way ANOVA |
Online |
|
| Testing for equal variances |
Online |
|
| Analyzing a balanced design |
Online |
|
| Entering random effects model |
Online |
|
| Using GLM for unbalanced designs |
Online |
|
| Analyzing covariance |
Online |
|
| Analyzing a fully nested design |
Online |
|
| The repeated measures ANOVA – using a mixed effects model |
Online |
|
| Finding the critical F-statistic |
Online |
|
| Regression and Modeling the Relationship between X and Y |
||
| Visualizing simple regressions with fitted line plots |
Online |
|
| Using the Assistant tool to run a regression |
Online |
|
| Multiple regression with linear predictors |
Online |
|
| Model selection tools – the best subsets regression |
Online |
|
| Model selection tools – the stepwise regression |
Online |
|
| Binary logistic regression |
Online |
|
| Fitting a nonlinear regression |
Online |
|
| 6. | Understanding Process Variation with Control Charts – Medium Course |
|
| Xbar-R charts and applying stages to a control chart |
Online |
|
| Using an Xbar-S chart |
Online |
|
| Using I-MR charts |
Online |
|
| Using the Assistant tool to create control charts |
Online |
|
| Attribute charts' P (proportion) chart |
Online |
|
| Testing for overdispersion and Laney P' chart |
Online |
|
| Creating a u-chart |
Online |
|
| Testing for overdispersion and Laney U' chart |
Online |
|
| Using CUSUM charts |
Online |
|
| Finding small shifts with EWMA |
Online |
|
| Control charts for rare events – T charts |
Online |
|
| Rare event charts – G charts |
Online |
|
| 7. | Capability, Process Variation, and Specifications – Medium Course |
|
| A capability and control chart report using the capability analysis six pack |
Online |
|
| Capability analysis for normally distributed data |
Online |
|
| Capability analysis for nonnormal distributions |
Online |
|
| Using a Box-Cox transformation for capability |
Online |
|
| Using a Johnson transformation for capability |
Online |
|
| Using the Assistant tool for short-run capability analysis |
Online |
|
| Comparing the capability of two processes using the Assistant tool |
Online |
|
| Creating an acceptance sampling plan for variable data |
Online |
|
| Creating an acceptance sampling plan for attribute data |
Online |
|
| Comparing a previously defined sampling plan – C = 0 plans | Online | |
| Generating run charts | Online | |
| Generating tolerance intervals for summarized data | Online | |
| Datasets that do not transform or fit any distribution | Online | |
| 8. | Measurement Systems Analysis – Advanced Course | |
| Analyzing a Type 1 Gage study | Online | |
| Creating a Gage R&R worksheet | Online | |
| Analyzing a crossed Gage R&R study | Online | |
| Studying a nested Gage R&R | Online | |
| Checking Gage linearity and bias | Online | |
| Expanding a Gage study with extra factors | Online | |
| Studying a go / no go measurement system | Online | |
| Using the Assistant tool for Gage R&R | Online | |
| Attribute Gage study from the Assistant menu | Online | |
| 9. | Multivariate Statistics – Advanced Course | |
| Finding the principal components of a set of data | Online | |
| Using factor analysis to identify the underlying factors | Online | |
| Analyzing consistency of a test paper using item analysis | Online | |
| Finding similarity in results by rows using cluster observations | Online | |
| Finding similarity across columns using cluster variables | Online | |
| Identifying groups in data using cluster K-means | Online | |
| The discriminant analysis | Online | |
| Analyzing two-way contingency tables with a simple correspondence analysis | Online | |
| Studying complex contingency tables with a multiple correspondence analysis | Online | |
| 10. | Time Series Analysis – Advanced Course | |
| Fitting a trend to data | Online | |
| Fitting to seasonal variation | Online | |
| Time series predictions without trends or seasonal variations | Online | |
| 11. | Summary | |
| Quick summary of previous learning | Online | |
| Advice from expert | Online | |
| Make a question | Online |
Pictures
| Course type | Basic , Medium , Advanced |
|---|