Offer Ends In !!
Statistics With JMP Course (Service Center, Manufacturing, Warehouse, Logistic...)
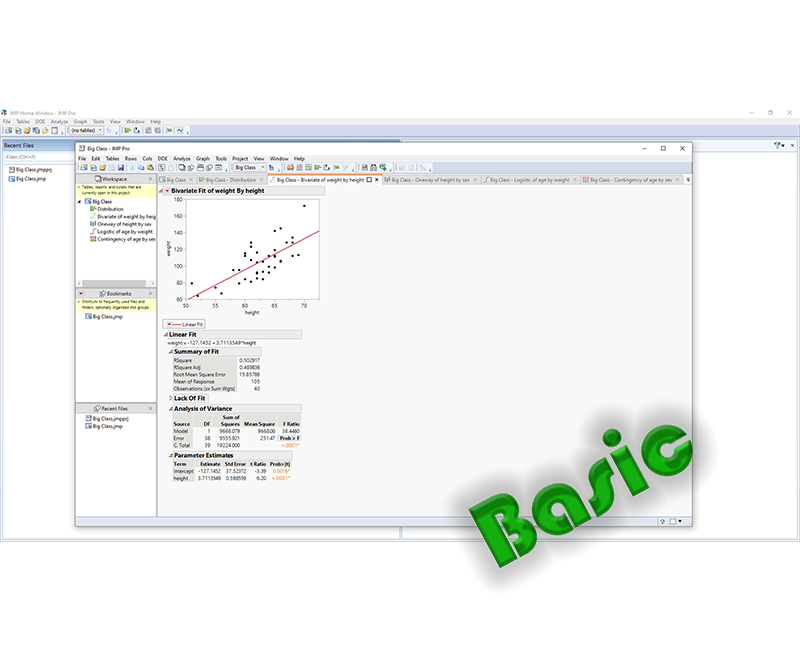
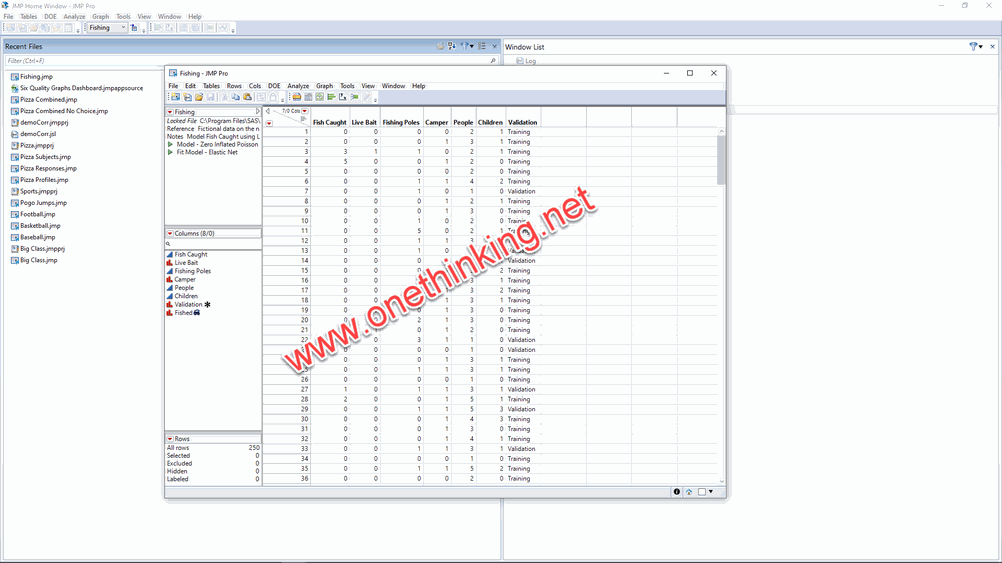
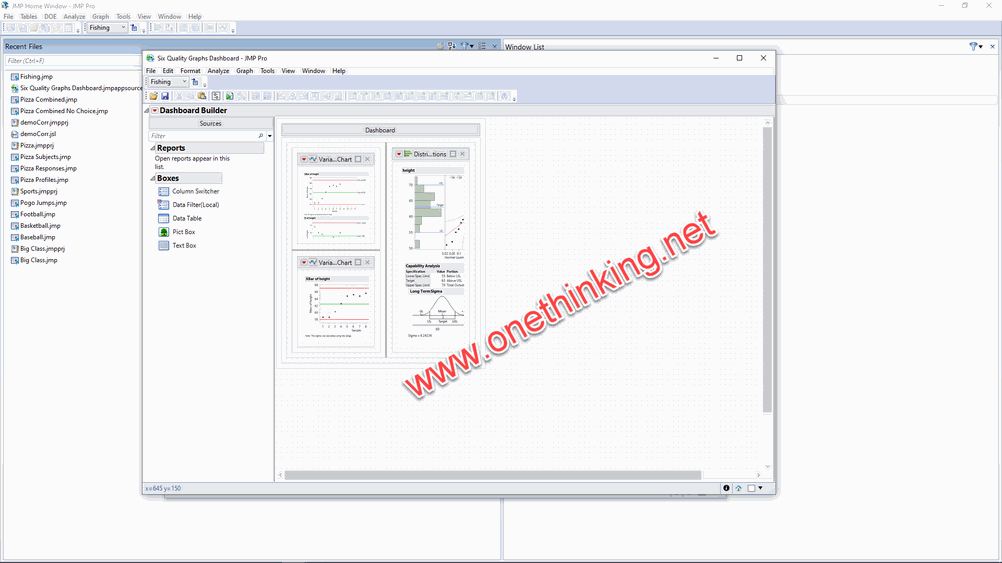
JMP is very powerful statistical software, JMP emphasizes interaction with data and graphics in a progressive structure for discovery.
- With graphics, you have more possibilities to explore. You are also more likely to understand the results.
- With interactivity, you are encouraged to dig deeper and...
READ MORE
READ MORE
This combination does not exist.
Introduction Video


Course Contents
Learners must have a basic knowledge of statistics.
| No. | Contents | Type |
|---|---|---|
| 1. | Getting Started with JMP |
|
| The first boot with JMP |
Infographic | |
| Customize JMP |
Infographic | |
| Modeling Type |
Infographic | |
| The Personality of JMP |
||
| 2. | Data Tables, Reports, and Scripts |
Infographic |
| The Ins and Outs of a JMP Data Table |
Infographic | |
| Creating a New JMP Table |
Infographic | |
| Importing Data |
||
| Moving Data Out of JMP |
Infographic | |
| Saving Graphs and Reports |
Infographic | |
| Juggling Data Tables |
Infographic | |
| Creating Summary Statistics |
||
| Working with Scripts |
Online | |
| 3. | Formula Editor |
Online |
| The Formula Editor Window |
Online | |
| Using Popular Formula Functions |
Online | |
| Working with Dates |
Online | |
| Tips on Building Formulas |
Online | |
| Exercises |
Online | |
| 4. | What Are Statistics? |
Online |
| Overview |
Online | |
| Pondering |
Online | |
| Preparations |
Online | |
| Statistical Terms |
Online | |
| 5. | Simulations |
|
| Overview |
Online | |
| Rolling Dice |
Online | |
| Probability of Making a Triangle |
Online | |
| Exercises |
Online |
|
| 6. | Univariate Distributions: One Variable, One Sample |
|
| Describing Distributions of Values |
Online |
|
| Statistical Inference on the Mean |
Online |
|
| Practical Significance versus Statistical Significance |
Online |
|
| Exercises |
Online |
|
| 7. | The Difference Between Two Means |
|
| Two Independent Groups |
Online |
|
| Normality and Normal Quantile Plots |
Online |
|
| Testing Means for Matched Pairs |
Online |
|
| Exercises |
Online |
|
| 8. | Comparing Many Means: One-Way Analysis of Variance |
|
| What Is a One-Way Layout? |
Online |
|
| Comparing and Testing Means |
Online |
|
| Adjusting for Multiple Comparisons |
Online |
|
| Are the Variances Equal across the Groups? |
Online |
|
| Exercises |
Online |
|
| 9. | Fitting Curves through Points: Regression |
|
| Polynomial Models |
Online |
|
| Transformed Fits |
Online |
|
| Are Graphics Important? |
Online |
|
| Why It’s Called Regression |
Online |
|
| Exercises |
Online |
|
| 10. | Categorical Distributions |
|
| Categorical Situations |
Online |
|
| Categorical Responses and Count Data: Two Outlooks |
Online |
|
| A Simulated Categorical Response |
Online |
|
| Univariate Categorical Chi-Square Tests |
Online |
|
| 11. | Categorical Models |
|
| Fitting Categorical Responses to Categorical Factors: Contingency Tables |
Online |
|
| If You Have a Perfect Fit |
Online |
|
| Exercises |
Online |
|
| 12. | Multiple Regression - Medium Course |
|
| 13. | Fitting Linear Models - Medium Course |
|
| The General Linear Model |
Online |
|
| Two-Way Analysis of Variance and Interactions |
Online |
|
| Exercises |
Online |
|
| 14. | Design of Experiments – Medium Course |
|
| A Simple Design |
Online |
|
| Using the Custom Designer |
Online |
|
| Response Surface Designs |
Online |
|
| Split-Plot Designs |
Online |
|
| Design Strategies |
Online |
|
| Exercises |
Online |
|
| 15. | Bivariate and Multivariate Relationships - Advanced Course |
|
| 16. | Exploratory Modeling - Advanced Course |
|
| 17. | Control Charts and Capability - Advanced Course |
|
| What Does a Control Chart Look Like |
Online |
|
| Types of Control Charts |
Online |
|
| Specialty Charts |
Online |
|
| Capability Analysis |
Online |
|
| Exercises |
Online |
|
| 18. | Mechanics of Statistics - Advanced Course |
|
| Overview |
Online |
|
| Springs for Continuous Responses |
Online |
|
| Mechanics of Fit for Categorical Responses |
Online |
|
| 19. | Summary |
|
| Quick summary of previous learning |
Online |
|
| Advice from expert |
Online |
|
| Make a question |
Online |
Pictures
| Course type | Basic , Medium , Advanced |
|---|

